Pollutant formation, sources and sinks: tropospheric ozone and PM2.5
Ozone (O3) occurs in both the troposphere and the stratosphere. Stratospheric O3 layer protects humans from harmful UV radiation. However, in terms of air quality, tropospheric or ground level O3 is a secondary pollutant, which forms due to chemical reactions with primary pollutants that are emitted directly from the source (e.g. carbon monoxide found in smoke). Greenhouse gases (e.g. methane), nitrogen oxides (NOx), and volatile organic compounds (VOCs)—all come from natural and anthropogenic emissions—react with sunlight and, in return, create O3 (American Chemical Society, 2020). Tropospheric ozone has negative impacts on human health and vegetation (crop damage). An increase in anthropo-genic activities/sources, such as automobiles, has led to higher levels of tropospheric ozone (American Chemical Society), as well as causing the depletion of the stratospheric ozone layer (McKendry & Lundgren, 2000).
In contrast to ozone, fine particulate matter (PM) is a mix of solid and liquid particles suspended in the atmosphere (aerosols) with varying chemical composition, shape, and size, and comes from natural and human sources that are found at the Earth’s surface (McKendry, 2000). Higher concentrations of fine particulate matter are often found in the atmospheric boundary layer (ABL) (and thus lower concentrations as height increases) due to aerosols originating from the surface (McKendry & Lundgren, 2000). Fine particulate matter with ≤ 2.5 microns in diameter is referred to as PM2.5; since it is less than 10 microns, PM2.5 is also included in PM10. Fine particulate matter also has negative implications on human health, usually associated with respiratory problems, and sometimes degrade visibility.
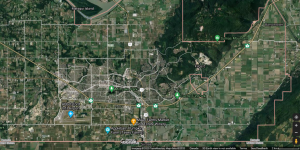
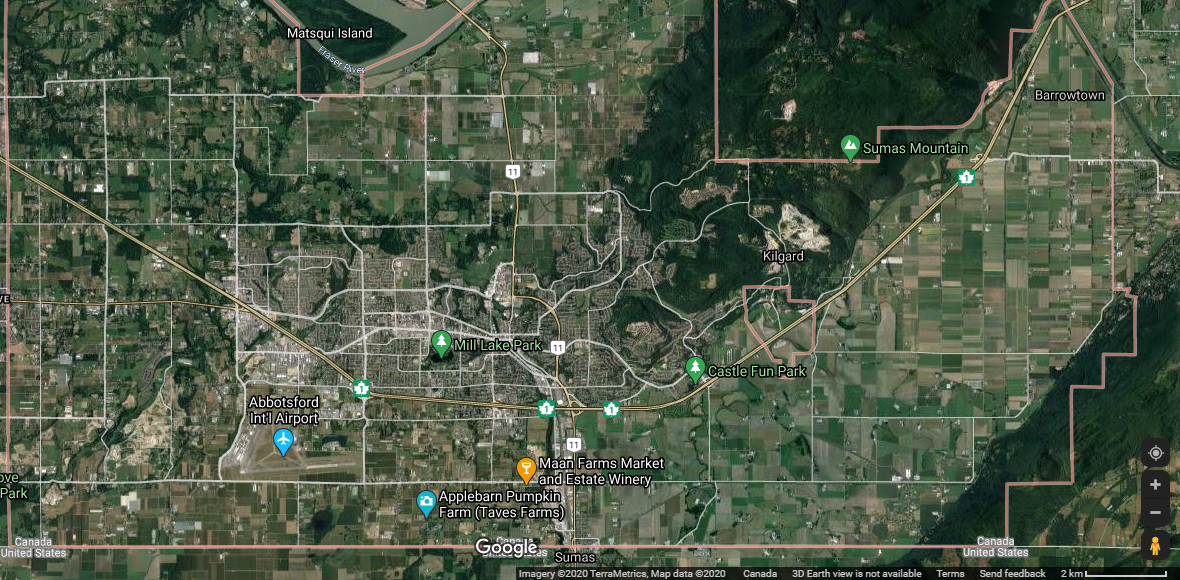
Further to the east from Vancouver are mainly rural areas like Abbotsford, which is situated roughly in the southwest region of the Lower Fraser Valley (LFV). Since the 1950s, the LFV has undergone some changes; the deindustrialization of the region has shifted concerns about pollutants from smoke and sulfur oxides to ground level ozone and fine particulate matter (Ainslie & Steyn, 2007). A previous study in the 1990s has shown that there has been an increasing trend of ozone, likely due to rapid population growth in the region (Ainslie et al., 2013). In Figure 1, a satellite imagery from Google Maps shows areas of Abbotsford where various human activities (that may be attributed to pollutants) occur. The urbanized parts/areas are in proximity to the airport, a significant source of air pollution. Meanwhile, a large portion surrounding the more urban environment is farmland. Farming activities can also contribute to the concentration levels of pollutants.
In Abbotsford and Chilliwack, there has been a concern regarding open air agricultural burning practices by farmers in order to eliminate waste material. According to the Fraser Valley Regional District’s report and previous studies, the said activity emits a PM2.5 footprint significantly that it accounts for around “7% of particulate matter…in the region” (Henderson, 2017, paras. 2-5). Open air burning is allowed in Abbotsford, only outside the urban areas, with certain requirements/permit and under strict conditions (i.e., prohibited during summer months).
Seasonal and diurnal variabilities
The boxplots show the seasonal and diurnal variability for Abbotsford in 2018. Each season consist of three full months: winter is defined as January 1 to March 31; spring as April 1 to June 30; summer as July 1 to September 30; and autumn as October 1 to December 31.
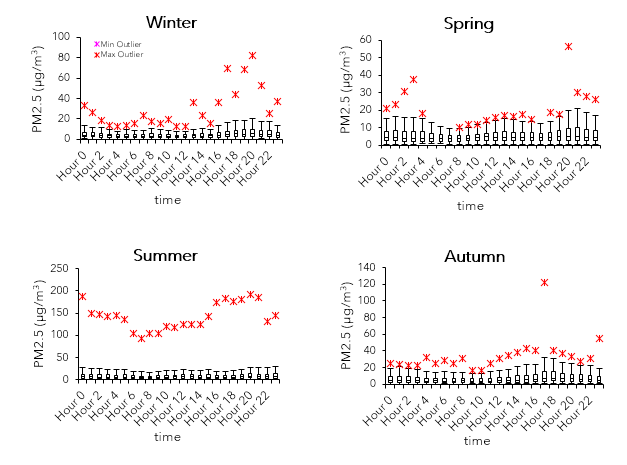
PM2.5 concentrations tend to be higher in the late afternoon and evening throughout the year. This pattern is likely due to warmer temperatures and increased automobile emissions during rush hours—since transportation is the dominating industry sector in the LFV, 58% of PM2.5 is mainly attributed to road dust, and 20% from other mobile sources (McKendry, 2000). Higher values are found in the summer (≥100 µg/m3), while the other seasons generally have max values sitting roughly at or below 40 µg/m3. According to Environmental Reporting BC (2019), the air quality standard for PM2.5 is at (24-hour) levels 28 µg/m3 or lower.
The diurnal pattern for ozone is akin to that of PM2.5, although elevated concentrations of PM2.5 tend to happen a bit later and closer to the evening. Peak concentrations of O3 typically occur between noon (12:00) and roughly late afternoon (16:00) because of the presence of sunlight and increased temperatures. In contrast to PM2.5, O3 patterns appear more consistent throughout the seasons. O3 levels are highest in the summer and relatively high in the spring, with max values close to or exceeding 50 ppb and minimum values (at periods of elevated concentrations) starting at around 10 ppb.
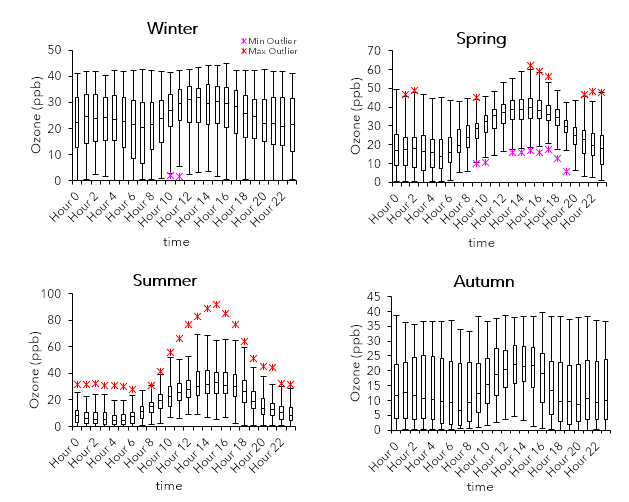
Meanwhile in the winter and autumn, the range of values falls below 50 ppb. The maximum acceptable level for ozone in Canada is 80-82 ppb (hourly), and concentrations beyond it will cause risks to human health and crops (McKendry, 1994).
Air quality is not only influenced by the sources of pollutants, but also by meteorological conditions such as wind speeds, air temperature, atmospheric stability, and inversion height (McKendry, 1994). Larger max values for both PM2.5 and ozone are found during the summer. This trend is likely caused by synoptic conditions that diminishes the air quality, especially since summer months are typically associated with warmer air and clear skies (McKendry, 1994). Furthermore, up-valley flows influenced by daytime see breezes in the summer can transport pollutants all over the region (McKendry, 2000). However, there also tend to be spikes occurring during hours between the evening and dawn for PM2.5. Compared to the spring and autumn, values in the winter during these hours are higher and seem to be correlated with cooler wind. The cold air and pollutants are ‘stuck’ at the surface because of a layer of warmer air above it, leading to a thermal inversion (UCAR, 2020). Additionally, combustion (in this case, due to agricultural burning practice) is a source of PM2.5, and an increase in burning activity during winter may account for these values. For ozone, levels tend to increase overnight presumably due to lower wind speeds and shorter urban boundary layer height. Meanwhile, increasing NOx emissions in the early morning to evening (NO scavenging: reaction with sunlight breaks down O3), as well as certain cases in which there is greater cloud cover, wind speeds, and precipitation (McKendry, 1993; 1994)—overall, cooler conditions—lower ozone concentrations.
References
Ainslie, B., & Steyn, D. G. (2007, October). Spatiotemporal Trends in Episodic Ozone Pollution in the Lower Fraser Valley, British Columbia, in Relation to Mesoscale Atmospheric Circulation Patterns and Emissions. Journal of Applied Meteorology and Climatology, 46(10), 1631-1644. Retrieved from http://ezproxy.library.ubc.ca/login?url=https://www-proquest-com.ezproxy.library.ubc.ca/docview/224377884?accountid=14656
Ainslie, B., Steyn, D. G., Reuten, C., & Jackson, P. L. (2013). A Retrospective Analysis of Ozone Formation in the Lower Fraser Valley, British Columbia, Canada. Part II: Influence of Emissions Reductions on Ozone Formation. Atmosphere-Ocean, 51(2), 170-186. doi:https://doi.org/10.1080/07055900.2013.782264
American Chemical Society. (2020). Greenhouse Gas Sources and Sinks. Retrieved from American Chemical Society: https://www.acs.org/content/acs/en/climatescience/greenhousegases/sourcesandsinks.html
Environmental Reporting BC. (2019, June). Status of Fine Particulate Matter in B.C. (2015-2017). British Columbia, Canada: State of Environment Reporting, Ministry of Environment and Climate Change Strategy. Retrieved from Province of British Columbia: http://www.env.gov.bc.ca/soe/indicators/air/fine-pm.html
Henderson, P. (2017, October 26). Looking at alternatives to open air burning in Chilliwack, Abbotsford. Retrieved from The Chilliwack Progress: http://ezproxy.library.ubc.ca/login?url=https://www-proquest-com.ezproxy.library.ubc.ca/docview/1956115062?accountid=14656
McKendry, I. G. (1993). Ground-Level Ozone in Montreal, Canada. Atmospheric Environment, 27B(1), 93-103. doi:https://doi.org/10.1016/0957-1272(93)90049-C
Mckendry, I. G. (1994). Synoptic Circulation and Summertime Ground-Level Ozone Concentrations at Vancouver, British Columbia. Journal of Applied Meteorology, 33(5), 627-641. doi:https://doi.org/10.1175/1520-0450(1994)033%3C0627:SCASGL%3E2.0.CO;2
McKendry, I. G. (2000). PM10 Levels in the Lower Fraser Valley, British Columbia, Canada: An Overview of Spatiotemporal Variations and Meteorological Controls. Journal of the Air & Waste Management Association, 50(3), 443-452. doi:https://doi.org/10.1080/10473289.2000.10464025
McKendry, I. G., & Lundgren, J. (2000). Tropospheric layering of ozone in regions of urbanized complex and/or coastal terrain: A review. Progress in Physical Geography, 24(3), 329-354. doi:http://dx.doi.org.ezproxy.library.ubc.ca/10.1177/030913330002400302
UCAR. (2020). How Weather Affects Air Quality. Retrieved from UCAR Centre for Science Education: https://scied.ucar.edu/learning-zone/air-quality/how-weather-affects-air-quality